Racially and Ethnically Motivated Violent Extremism (REMVE) and Targeted Violence Arrests 2011-2020
A (recovered) dataset of federal arrests in the United States between 2011 and 2020 for racially and ethnically motivated violent extremism (REMVE). Original data collection by a team of researchers at the University of North Carolina.
I have discussed with students in my courses on Political Violence and on Far-Right Socio-Politics facets of domestic terrorism and violent extremism. Recently, I was reminded of a dataset produced by the University of North Carolina (UNC) on Racially and Ethnically Motivated Violent Extremism (REMVE) and Targeted Violence Arrests 2011-2020 (introduced in a brief blog here: https://www.opendemocracy.net/en/countering-radical-right/documenting-domestic-terrorism-us-new-dataset-exposes-legal-response/). The dataset consists of manually coded observations of “individuals arrested and charged for federal [NB: not state level] crimes linked to ‘domestic’ terrorism stemming from white supremacist, nationalist, accelerationist, and male supremacist ideological cultures and groups.”
Unfortunately, the original dataset publication is no longer available; but fortunately, I had a copy saved. The interactive map1 below represents the full dataset. By hovering over a state, one can see how many REMVE federal arrests were made there over the 2010s.
The dataset contains 675 rows (i.e. arrests), most of which proceeded through to charges, indictment, and sentencing. 548 of the named individuals are males, compared to 113 females. The average age, where this information is available (in 77.9% of cases), is 37 years old.
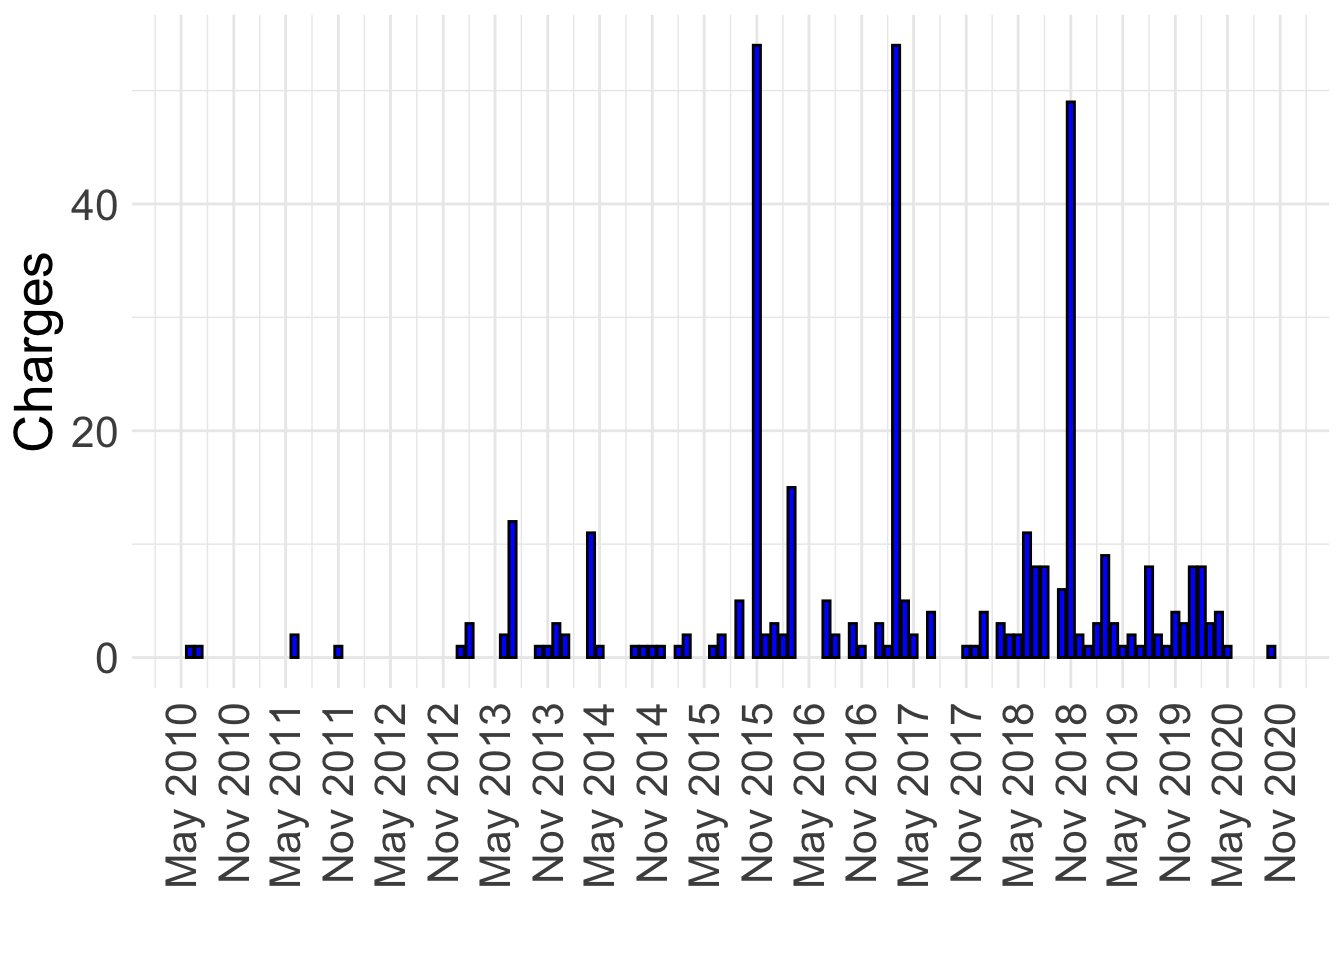
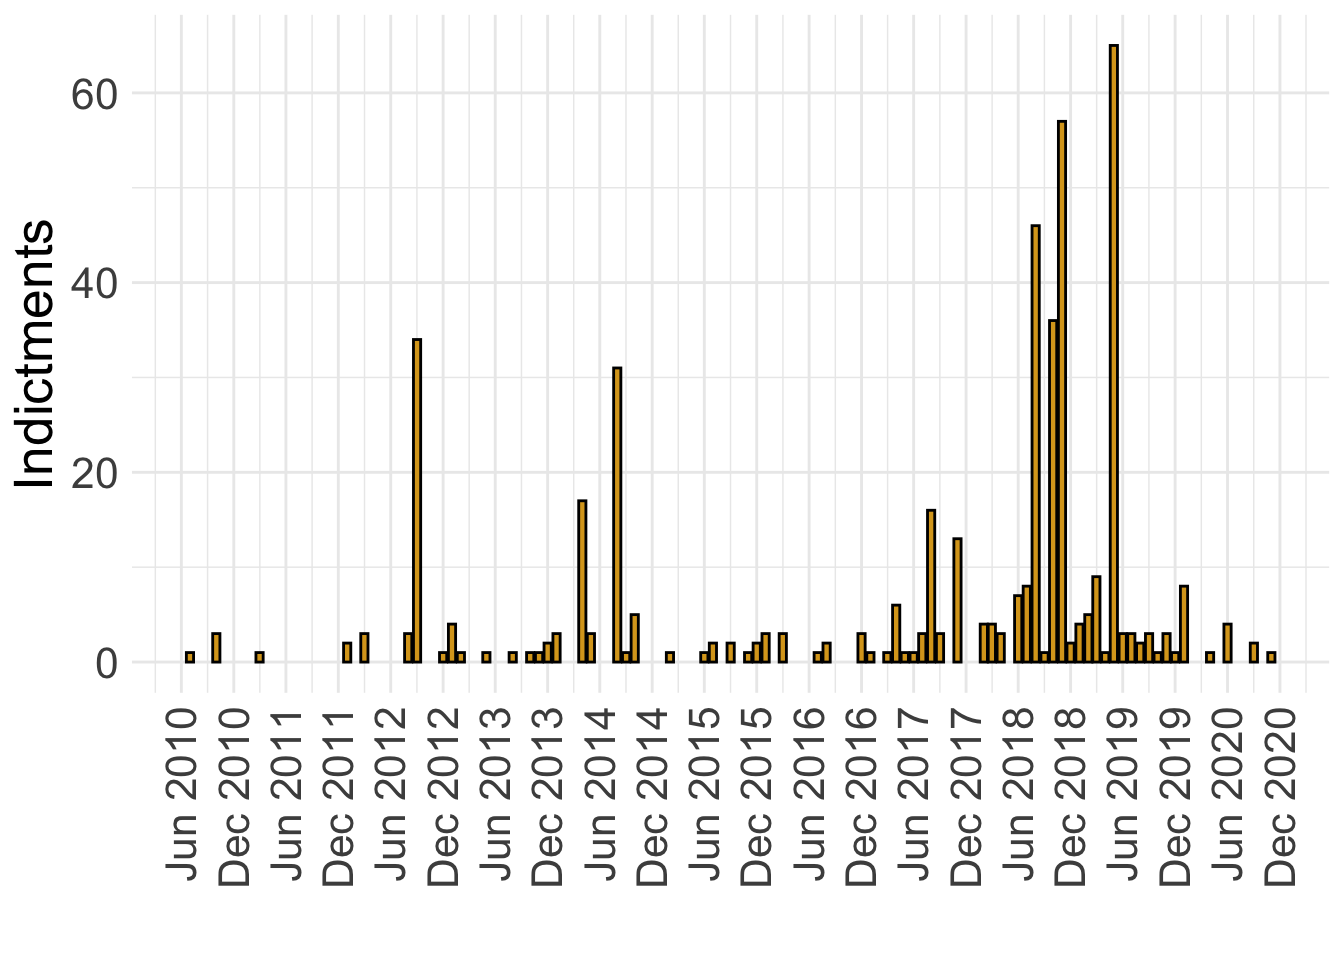
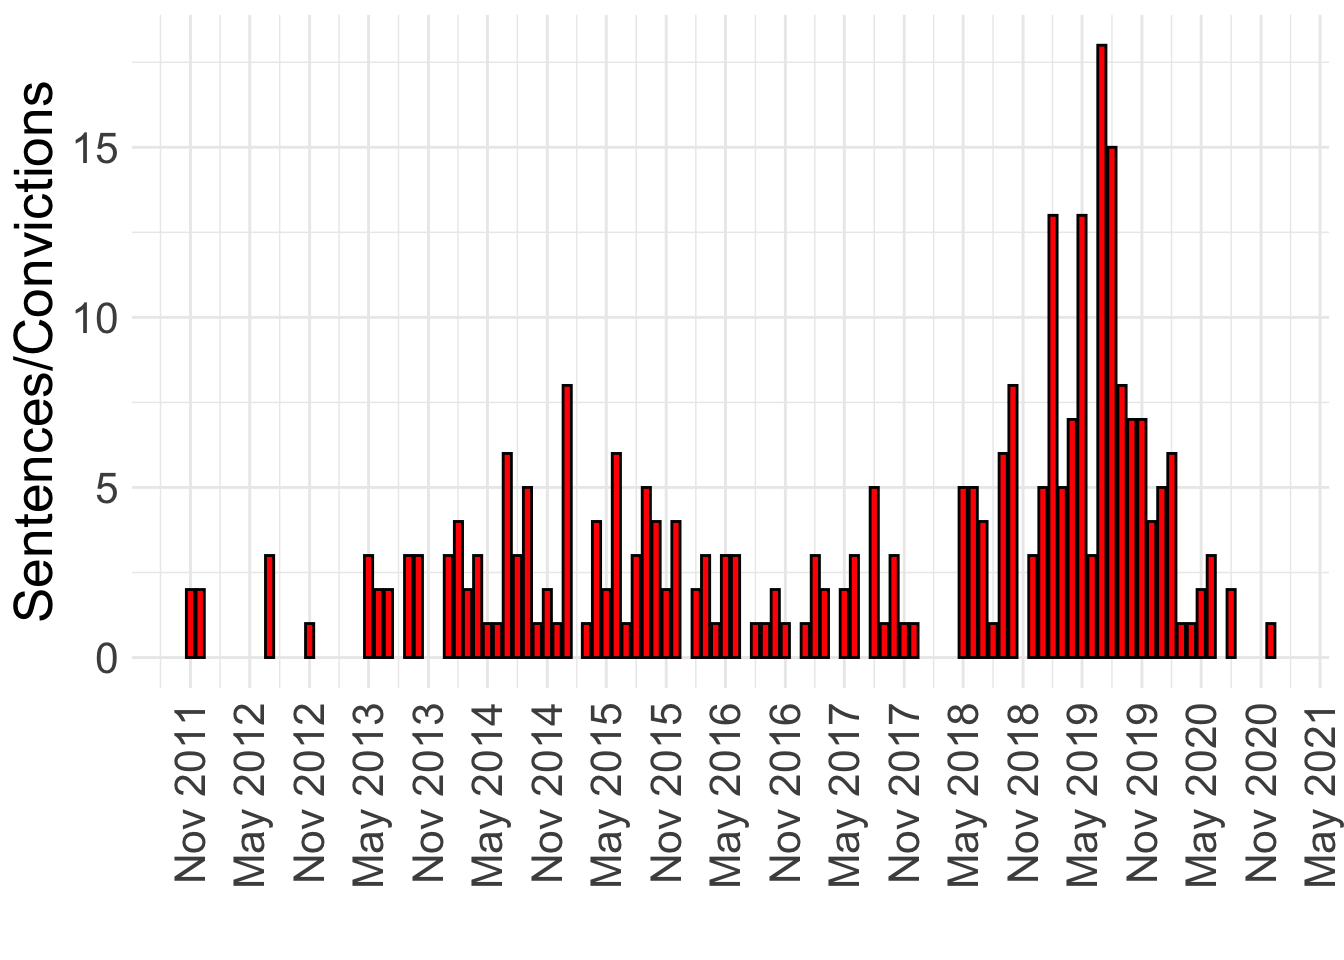
The dataset also contains, albeit inconsistently, with several missing values, dates of arrest, charging, indictment, and sentencing. These data are reflected in the bar graphs below.
Arrests
Charges
Indictments
Sentences/Convictions
The full dataset includes individual’s names and personal details. Some of the legal proceedings involving these individuals were still pending when the data was collected. Since I am not certain how (or if!) these cases concluded, I will not publish the full identifiable information—just the demographic and procedural details in the sortable table below. One other particularly interesting element is contained in the original dataset: the group affiliation(s) of the arrested individuals. If time allows, I will do further work to pick out these data and represent them.
Footnotes
This Observable JS map was produced with the assistance of Andrew Heiss’s tutorial: Heiss, Andrew. 2025. “Using USAID Data to Make Fancy World Maps with Observable Plot.” February 10, 2025. https://doi.org/10.59350/c0aep-hp989.↩︎
Source Code
---title: Racially and Ethnically Motivated Violent Extremism (REMVE) and Targeted Violence Arrests 2011-2020date: 2025-12-24description: "A (recovered) dataset of federal arrests in the United States between 2011 and 2020 for racially and ethnically motivated violent extremism (REMVE). Original data collection by a team of researchers at the University of North Carolina."image: dom_terror.pngtwitter-card: image: "dom_terror.png"open-graph: image: "dom_terror.png"categories: - extremism - far right - right-wing extremism---```{r setup, include=FALSE}knitr::opts_chunk$set(echo = FALSE, message = FALSE, warning = FALSE, paged.print = FALSE)```I have discussed with students in my courses on [Political Violence](https://michaelzeller.de/course-pv/) and on [Far-Right Socio-Politics](https://michaelzeller.de/course-fr/) facets of domestic terrorism and violent extremism. Recently, I was reminded of a dataset produced by the University of North Carolina (UNC) on *Racially and Ethnically Motivated Violent Extremism (REMVE) and Targeted Violence Arrests 2011-2020* (introduced in a brief blog here: <https://www.opendemocracy.net/en/countering-radical-right/documenting-domestic-terrorism-us-new-dataset-exposes-legal-response/>). The dataset consists of manually coded observations of "individuals arrested and charged for federal [NB: not state level] crimes linked to 'domestic' terrorism stemming from white supremacist, nationalist, accelerationist, and male supremacist ideological cultures and groups." Unfortunately, the original dataset publication is no longer available; but fortunately, I had a copy saved. The interactive map^[This Observable JS map was produced with the assistance of Andrew Heiss's tutorial: Heiss, Andrew. 2025. “Using USAID Data to Make Fancy World Maps with Observable Plot.” February 10, 2025. <https://doi.org/10.59350/c0aep-hp989>.] below represents the full dataset. By hovering over a state, one can see how many REMVE federal arrests were made there over the 2010s. ```{r}library(readxl)library(dplyr)unc_remve <-read_excel("UNC-Dataset-8_8_2020.xlsx", sheet="edit") unc_remve <- unc_remve %>%filter(!State =='Alaska')``````{r}#| eval: false#| include: falseunc_remve_grouped <- unc_remve %>%group_by(State) %>%summarise(COUNT=n())write.csv(unc_remve_grouped, "unc_remve_grouped.csv")##~~~~~~~~~~~~~~~~~~~~~~~~~~~~~~~~~~~~~~~library(sf)library(rnaturalearth)# Get low resolution Natural Earth data as map units instead of countries because of France# world <- ne_countries(scale = 110, type = "map_units")us_states <-ne_states(iso_a2="US", returnclass="sf")bbox <-c(xmin =-127, ymin =20, xmax =-60, ymax =50)us_states_cropped <-st_crop(us_states, bbox)# Save as geojson for Observable Plotst_write(obj = us_states_cropped, dsn ="ne_us_cropped.geojson", driver ="GeoJSON")``````{ojs}//| echo: falsemap_us = FileAttachment("ne_us_cropped.geojson").json()// Plot.plot({// marks: [// Plot.geo(map_us)// ]// })// Plot.plot({// marks: [// Plot.frame({ fill: "#D9F0FF" }), // Plot.geo(map_us, { // stroke: "black", // strokeWidth: 0.5, // fill: "#facba6"// }) // ]// })```<!-- https://observablehq.com/@observablehq/input-file -->```{ojs}//| echo: falseoj_unc = FileAttachment("unc_remve_grouped.csv").csv()// oj_unc``````{ojs}//| echo: falsestate_totals = new Map(oj_unc.map(d => [d["State"], d.COUNT]))// state_totalsfunction format_arrests_total(value) { return value ? d3.format("d")(value) : "No arrests";}``````{ojs}//| echo: falsePlot.plot({ marks: [ // Plot.frame({ stroke: "black", strokeWidth: 1} ), Plot.geo(map_us, Plot.centroid({ fill: d => state_totals.get(d.properties.name), channels: { State: d => d.properties.name, }, tip: { fontSize: 14, format: { State: true, fill: d => format_arrests_total(d) } } })), Plot.geo(map_us, { stroke: "black", strokeWidth: 0.5 }) ], // https://observablehq.com/@observablehq/plot-cheatsheets-colors x:{axis:null}, y:{axis:null}, color: { scheme: "reds", unknown: "#f2f2f2", type: "log", // "linear" legend: true, label: "Total REMVE arrests", style: { "font-size": "16px" } }})``````{r}unc_remve <-read_excel("UNC-Dataset-8_8_2020.xlsx", sheet="edit") unc_remve$Charged <-as.Date(unc_remve$ChargeDate_clean, "%m/%d/%Y")unc_remve$Arrested <-as.Date(unc_remve$ArrestDate_clean, "%m/%d/%Y")unc_remve$Indicted <-as.Date(unc_remve$IndictmentDate_clean, "%m/%d/%Y")unc_remve$Sentenced <-as.Date(unc_remve$SentenceDate_clean, "%m/%d/%Y")```The dataset contains **`r nrow(unc_remve)`** rows (i.e. arrests), most of which proceeded through to charges, indictment, and sentencing. **`r nrow(subset(unc_remve, Gender=='M'))`** of the named individuals are males, compared to **`r nrow(subset(unc_remve, Gender=='F'))`** females. The average age, where this information is available (in `r round(nrow(subset(unc_remve, !(is.na(Age))))/nrow(unc_remve)*100, 1)`% of cases), is **`r round(mean(subset(unc_remve, !(is.na(Age)))$Age), 0)`** years old.The dataset also contains, albeit inconsistently, with several missing values, dates of arrest, charging, indictment, and sentencing. These data are reflected in the bar graphs below.## Arrests```{r}library(ggplot2)library(lubridate)unc_remve %>%mutate(month=floor_date(Arrested, "month")) %>%group_by(month) %>%summarise(count=n()) %>%ggplot(aes(x=month, y=count)) +geom_bar(stat="identity", colour="black", fill="purple") +## format x-axis for monthsscale_x_date("", labels=scales::date_format("%b %Y"), breaks="6 month") +scale_y_continuous("", breaks =seq(0,22,2), minor_breaks =seq(0,22,1), limits =c(0,22))+theme_minimal() +theme(text=element_text(size=20),axis.text.x=element_text(angle=90, hjust=1, vjust =0.5) )```## Charges```{r}unc_remve %>%mutate(month=floor_date(Charged, "month")) %>%group_by(month) %>%summarise(count=n()) %>%ggplot(aes(x=month, y=count)) +geom_bar(stat="identity", colour="black", fill="blue") +## format x-axis for monthsscale_x_date("", labels=scales::date_format("%b %Y"), breaks="6 month") +scale_y_continuous("Charges", breaks =seq(0,55,5), minor_breaks =seq(0,55,5), limits =c(0,55))+theme_minimal() +theme(text=element_text(size=20),axis.text.x=element_text(angle=90, hjust=1, vjust =0.5) )```## Indictments```{r}unc_remve %>%mutate(month=floor_date(Indicted, "month")) %>%group_by(month) %>%summarise(count=n()) %>%ggplot(aes(x=month, y=count)) +geom_bar(stat="identity", colour="black", fill="goldenrod") +scale_x_date("", labels=scales::date_format("%b %Y"), breaks="6 month") +scale_y_continuous("Indictments", breaks =seq(0,65,10), minor_breaks =seq(0,65,5), limits =c(0,65))+theme_minimal() +theme(text=element_text(size=20),axis.text.x=element_text(angle=90, hjust=1, vjust =0.5) )```## Sentences/Convictions```{r}unc_remve %>%mutate(month=floor_date(Sentenced, "month")) %>%group_by(month) %>%summarise(count=n()) %>%ggplot(aes(x=month, y=count)) +geom_bar(stat="identity", colour="black", fill="red") +scale_x_date("", labels=scales::date_format("%b %Y"), breaks="6 month") +scale_y_continuous("Sentences/Convictions", breaks =seq(0,18,2), minor_breaks =seq(0,18,1), limits =c(0,18))+theme_minimal() +theme(text=element_text(size=20),axis.text.x=element_text(angle=90, hjust=1, vjust =0.5),# legend.position = "bottom" )```The full dataset includes individual's names and personal details. Some of the legal proceedings involving these individuals were still pending when the data was collected. Since I am not certain how (or if!) these cases concluded, I will not publish the full identifiable information---just the demographic and procedural details in the sortable table below. One other particularly interesting element is contained in the original dataset: the group affiliation(s) of the arrested individuals. If time allows, I will do further work to pick out these data and represent them.```{r}library(DT)unc_remve_tab <- unc_remve %>% dplyr::select(District, State, Age, Gender, Race, `Group Affiliation`, `Multi-Person Arrest`, Arrested, Charged, Indicted, Sentenced)datatable(unc_remve_tab, rownames =FALSE,caption ='REMVE case details.',filter ='top', options =list(pageLength =10, autoWidth =TRUE))```<!-- ****** --><!-- ```{ojs} --><!-- //| echo: false --><!-- d3 = require("d3@7") --><!-- ``` --><!-- ```{ojs} --><!-- //| echo: false --><!-- data = FileAttachment("palmer-penguins.csv").csv({ typed: true }) --><!-- ``` --><!-- ```{ojs} --><!-- //| echo: false --><!-- viewof bill_length_min = Inputs.range( --><!-- [32, 50], --><!-- {value: 35, step: 1, label: "Bill length (min):"} --><!-- ) --><!-- viewof islands = Inputs.checkbox( --><!-- ["Torgersen", "Biscoe", "Dream"], --><!-- { value: ["Torgersen", "Biscoe"], --><!-- label: "Islands:" --><!-- } --><!-- ) --><!-- ``` --><!-- ```{ojs} --><!-- //| echo: false --><!-- filtered = data.filter(function(penguin) { --><!-- return bill_length_min < penguin.bill_length_mm && --><!-- islands.includes(penguin.island); --><!-- }) --><!-- ``` --><!-- ```{ojs} --><!-- //| echo: false --><!-- Plot.rectY(filtered, --><!-- Plot.binX( --><!-- {y: "count"}, --><!-- {x: "body_mass_g", fill: "species", thresholds: 20} --><!-- )) --><!-- .plot({ --><!-- facet: { --><!-- data: filtered, --><!-- x: "sex", --><!-- y: "species", --><!-- marginRight: 80 --><!-- }, --><!-- marks: [ --><!-- Plot.frame(), --><!-- ] --><!-- } --><!-- ) --><!-- ``` --><!-- https://quarto.org/docs/interactive/ojs/libraries.html --><!-- https://observablehq.com/@d3/zoomable-sunburst -->******<!-- <span style="font-family:Garamond; font-size:0.8em;">A version of this blog was originally published by <a href="https://theloop.ecpr.eu/">The Loop</a></span> --><!-- <a href="https://www.eurozine.com/tiktok-populism/">https://www.eurozine.com/tiktok-populism/</a></span> -->