Poland’s run-off Presidential Election saw Karol Tadeusz Nawrocki, aligned with the ultra-conservative Law and Justice (Prawo i Sprawiedliwość, PiS) party, narrowly defeat Rafał Kazimierz Trzaskowski, aligned with the Civic Coalition (Koalicja Obywatelska, KO) party and Donald Tusk’s new centrist coalition. The results show familiar east-west and urban-rural divides in Polish politics, with eastern and rural areas favouring the ultra-conservatism of PiS and Nawrocki, and western and urban areas voting for Trzaskowski and tending to support centrist or left-wing parties.
Presidential Run-Off Results
It seems Poland’s Statistical Office does not offer an openly accessible shapefile for its subnational data, so we have to rely on the GADM geospatial files. We can merge that spatial data with the results at the commune (gminy) level provided by the National Electoral Commission: https://wybory.gov.pl/prezydent2025/en/dane_w_arkuszach. This allows us to visualise the geospatial divides in Polish politics at a highly granular level.
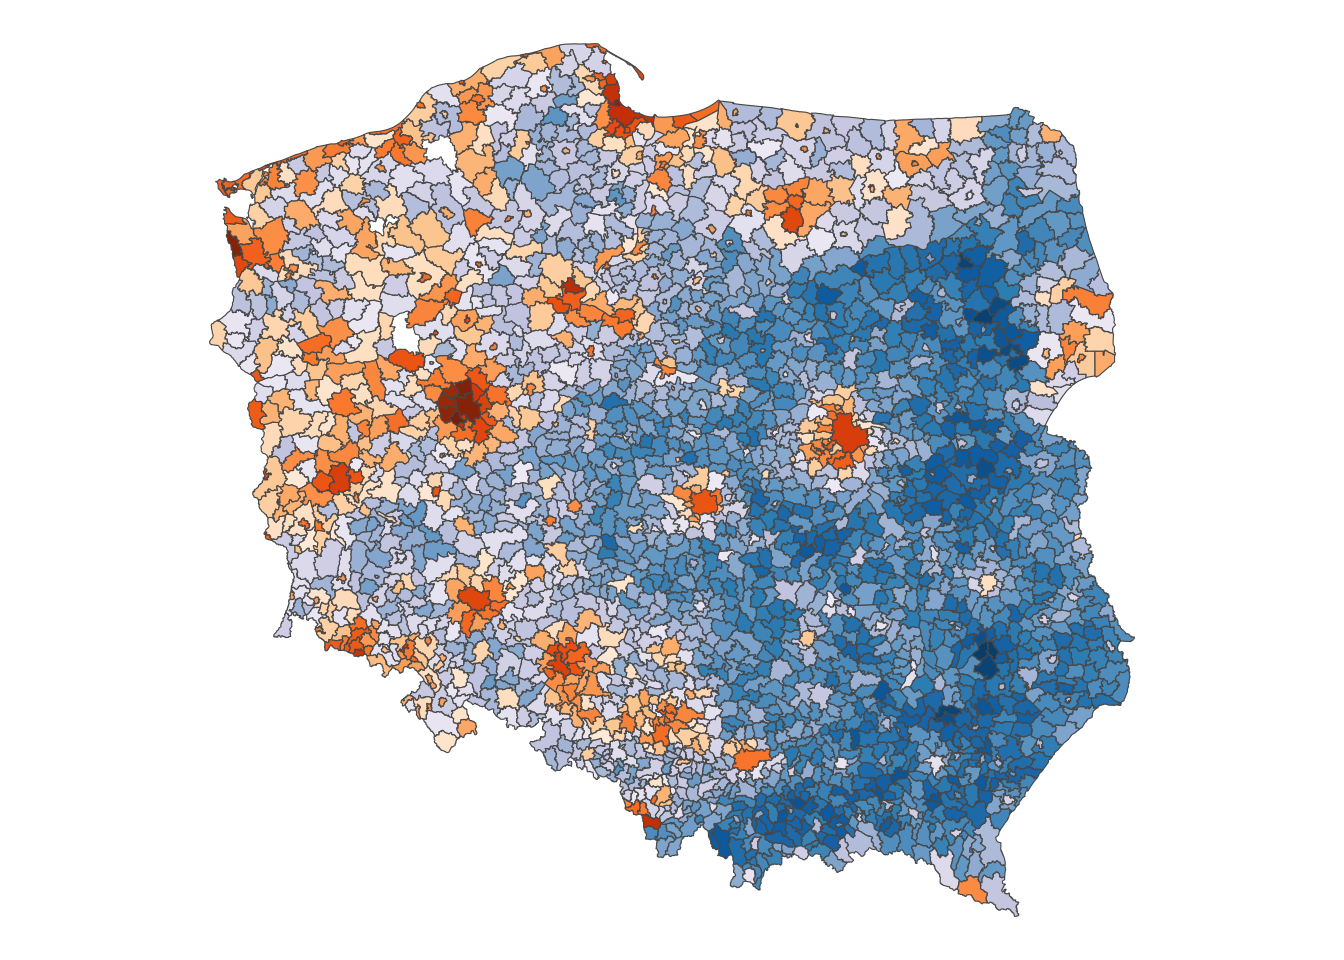
Figure 1 and Figure 2 show the stark east-west division. And similar to other countries, larger cities—here Warsaw, Poznań, Wrocław, Kraków, Gdańsk—are islands of more left-wing values and political support.
Figure 1: Map of presidential election results by commune. Darker blue communal areas voted more strongly for Karol Nawrocki. Darker orange communal areas voted more strongly for Rafał Trzaskowski.
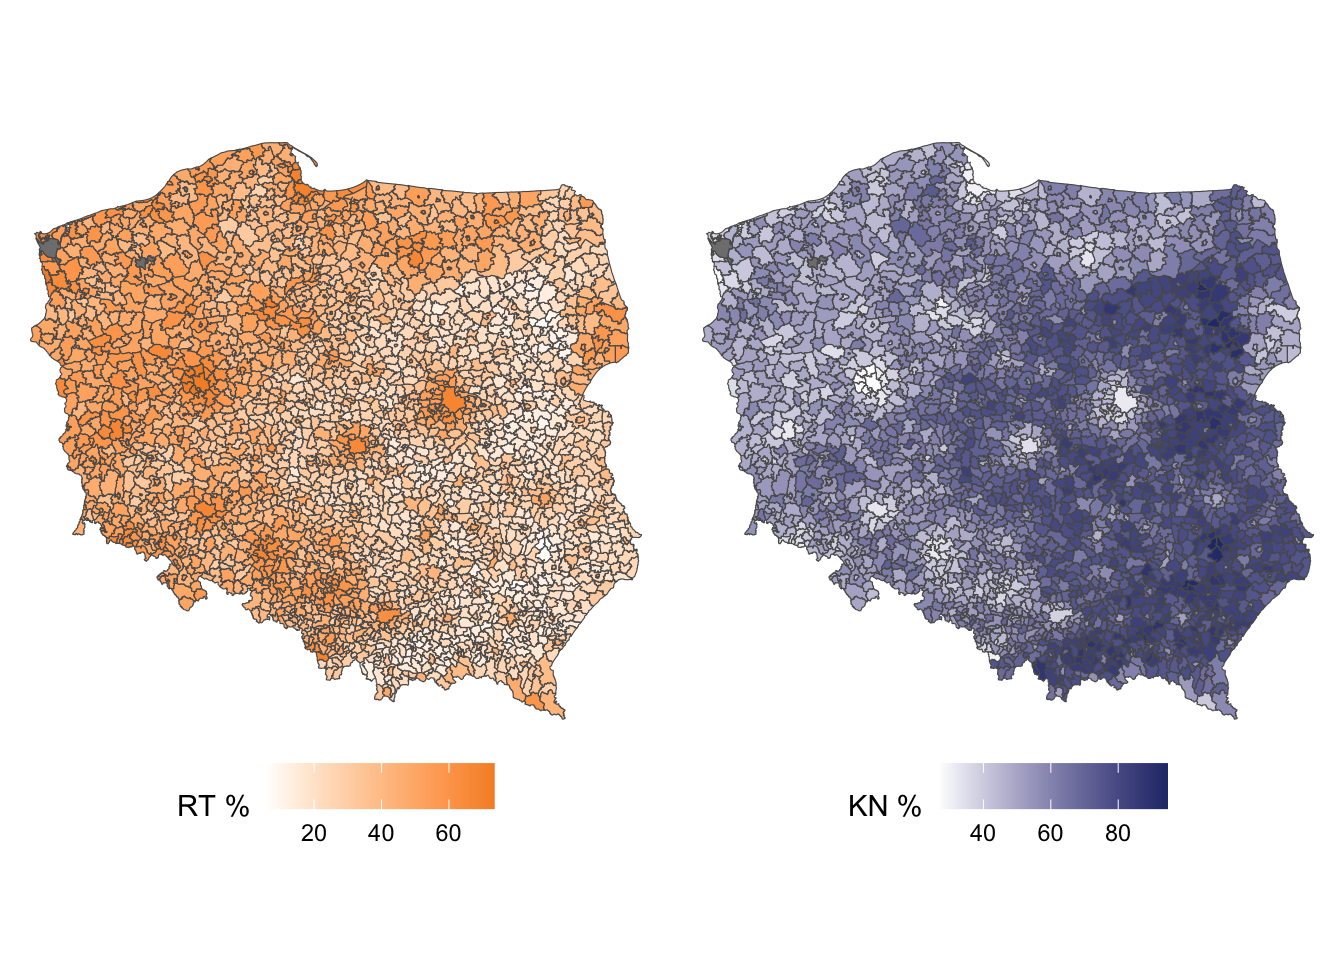
Figure 2: Maps of communes coloured by strength of electoral performance. The left map shows Trzaskowski’s performance in the run-off presidential election; the right map shows Nawrocki’s.
2023 Sejm Election Results
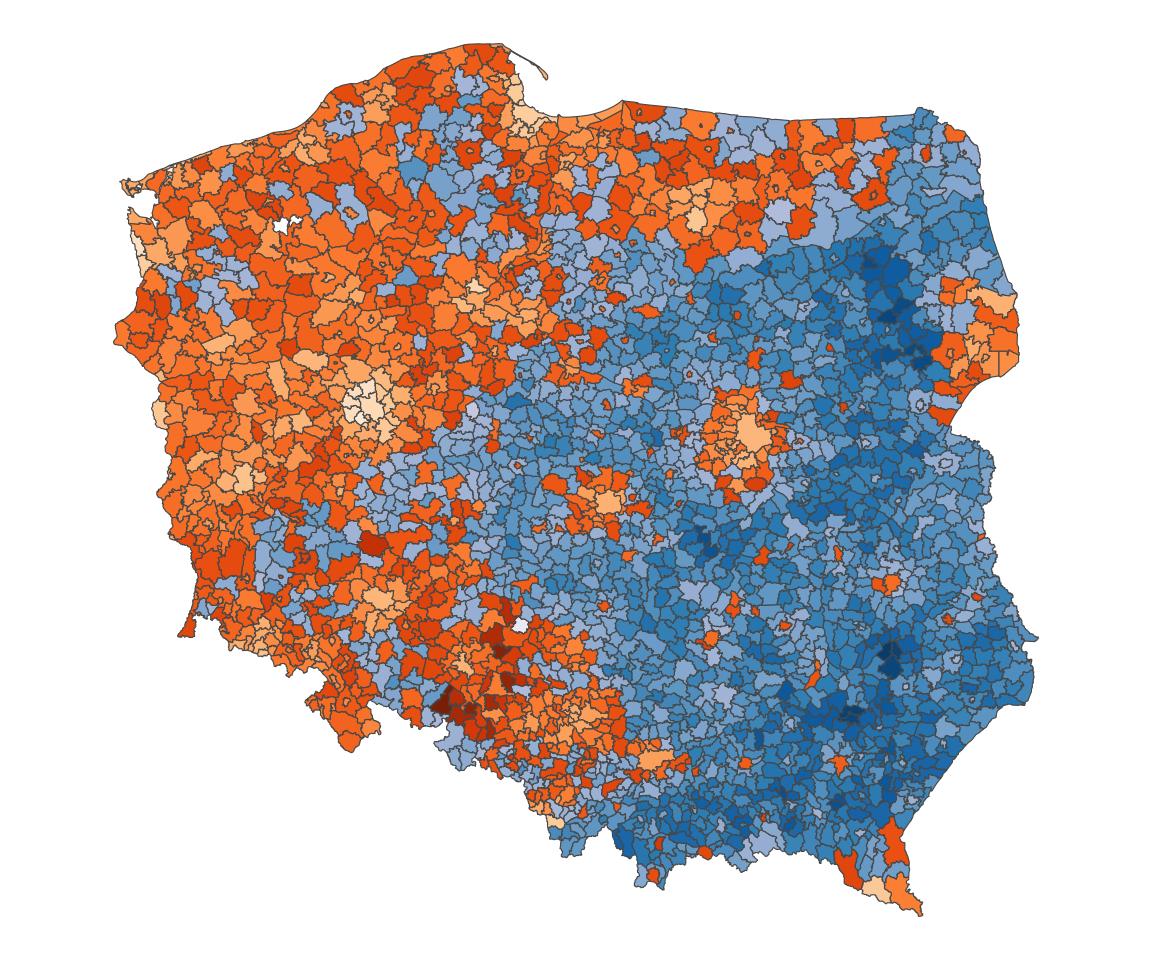
Geospatial patterns in the 2025 Presidential Run-Off were also present in the parliamentary elections of late 2023 (https://sejmsenat2023.pkw.gov.pl/sejmsenat2023/en/dane_w_arkuszach). Figure 3 show the electoral map of communes for the Sejm by grouping (in orange) the parties that eventually joined Donald Tusk’s coalition government—KO, Polska 2050, Polskie Stronnictwo Ludowe, and Nowa Lewica—and grouping (in blue) the PiS-led United Right alliance and the far-right Konfederacja party. The same patterns of east-west and rural-urban are readily apparent, though the overall electoral performance by the then-opposition parties was stronger than Trzaskowski in the run-off.
Figure 3: Map of parliamentary election results
Change from 2023 to 2025
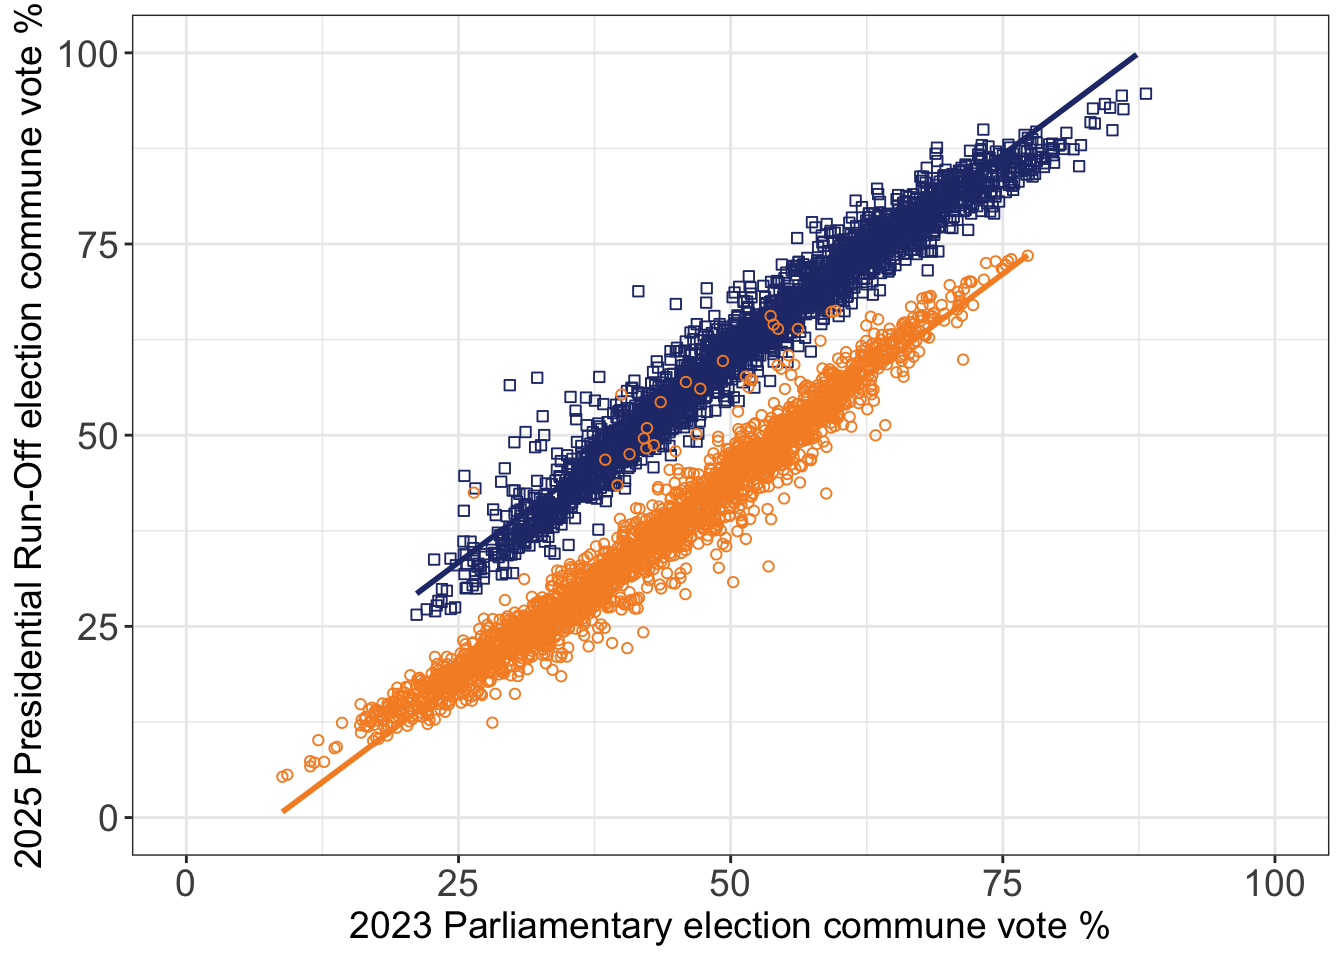
Figure 4 shows that, whereas Trzaskowski underperformed from the 2023 cumulative election performance of the parties that eventually formed current government coalition, Nawrocki generally overperformed.
Figure 4: Correlation of 2023 Sejm results and 2025 Presidential Run-Off results.
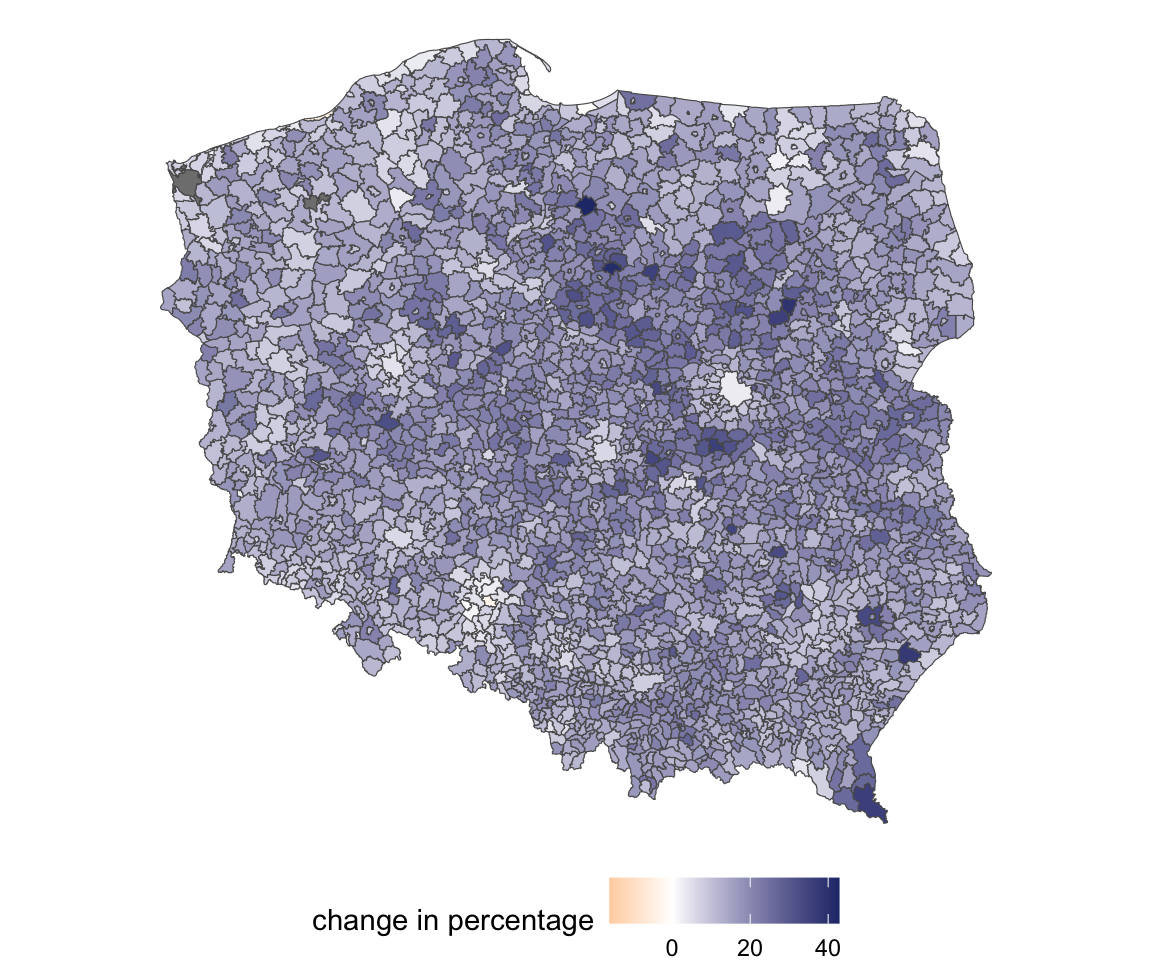
This differential is even clearer in Figure 5 where most communes shifted their vote to Nawrocki.
Figure 5: Map of shifts in election percentage. The sea of blue shades show that voting in most communes (whether due to changes in turnout or changes in voter preference) shifted from 2023 to 2025.
These geospatial patterns overall represent continuity in Polish political divisions, perhaps combined with two elections of high oppositional turnout. But continued divided government, with parliament controlled by Tusk’s centrist coalition and the presidency occupied by the PiS-aligned Nawrocki, will likely constrain or stymie Tusk’s legislative agenda. Among other repercussions, this means that it will be harder to unwind some of the illiberalising changes imposed by the previous PiS-led governments.
Source Code
---title: Polish Presidential Election 2025date: 2025-06-03description: "Poland's 2025 presidential election results at the communal level. (Photo: Wojtek Radwanski (AFP))"image: Nawrocki.pngtwitter-card: image: "Nawrocki.png"open-graph: image: "Nawrocki.png"categories: - Poland - elections---<!-- __*Updated on XX June 2025*__ --><!-- *Photo: Wojtek Radwanski (AFP)* --><!-- <https://www.sueddeutsche.de/politik/warschau-praesidentschaftswahl-trzaskowski-nawrocki-li.3258132> -->```{r setup, include=FALSE}knitr::opts_chunk$set( echo = FALSE, message = FALSE, warning = FALSE, collapse = TRUE, comment = "#>" # fig.keep = "all", # dev = c("pdf","png"), # dpi = 800, # cache = TRUE )## https://www.njtierney.com/post/2018/02/28/three-r-tips/## "cache=TRUE" means to save all my output the first time you run it, so I don’t have to wait forever for my rmarkdown document to run```Poland's run-off Presidential Election saw Karol Tadeusz Nawrocki, aligned with the ultra-conservative Law and Justice (*Prawo i Sprawiedliwość*, PiS) party, narrowly defeat Rafał Kazimierz Trzaskowski, aligned with the Civic Coalition (*Koalicja Obywatelska*, KO) party and Donald Tusk's new centrist coalition. The results show familiar east-west and urban-rural divides in Polish politics, with eastern and rural areas favouring the ultra-conservatism of PiS and Nawrocki, and western and urban areas voting for Trzaskowski and tending to support centrist or left-wing parties.<!-- Election results from National Electoral Commission: <https://wybory.gov.pl/prezydent2025/en/dane_w_arkuszach> --><!-- Gminy shapefile: <https://gis.openforestdata.pl/layers/geonode_data:geonode:Gminy_wgs84> --><!-- Eurostat NUTS data: <https://ec.europa.eu/eurostat/web/gisco/geodata/statistical-units/territorial-units-statistics> -->```{r data-setup, message=FALSE, warning=FALSE, include=FALSE}library(tidyverse)library(tidygeocoder)library(ggplot2)library(sf)library(rnaturalearth)library(mapview)library(dplyr)library(spatstat)library(leafpop)library(readxl)# PL25<-st_read("Gminy_wgs84/Gminy_wgs84.shp")# PL25<-st_read("gminy/gminy.shp")## from https://gadm.org/download_country.htmlPL25<-st_read("gadm41_POL_shp/gadm41_POL_3.shp")## takes a minute to render# ggplot(PL25)+geom_sf()# ## set aside Warsaw before this next manoeuvre# warsaw <- PL25 %>% filter(NAME_2=="Warszaw Zachodni")# class(PL25$CC_3)## remove last digit in column to make it match with identifiers from Polish NECPL25$CC_3 = substr(PL25$CC_3, 1, nchar(PL25$CC_3) - 1)# ## add warsaw back in -- first remove the rows left there# PL25 <- PL25 %>% dplyr::filter(NAME_2 !="Warszaw Zachodni")# # PL25 <- rbind(PL25, warsaw)PL25$CC_3 <- as.numeric(PL25$CC_3)library(readr)commune_r2 <- read_delim("pl_second_round/wyniki_gl_na_kandydatow_po_gminach_w_drugiej_turze_utf8.csv", delim = ";", escape_double = FALSE, trim_ws = TRUE)# View(commune_r2)commune_r2 <- commune_r2 %>% dplyr::select(`TERYT Gminy`, Gmina, Powiat, Województwo, `Liczba głosów ważnych oddanych łącznie na wszystkich kandydatów`, `NAWROCKI Karol Tadeusz`, `TRZASKOWSKI Rafał Kazimierz`) %>% dplyr::rename(TERYT = `TERYT Gminy`, Votes = `Liczba głosów ważnych oddanych łącznie na wszystkich kandydatów`, NAWROCKI = `NAWROCKI Karol Tadeusz`, TRZASKOWSKI = `TRZASKOWSKI Rafał Kazimierz`)## remove rows with NA for Województwocommune_r2 <- commune_r2[!is.na(commune_r2$Województwo),]## take out Warsaw districts and combine themwarsaw <- commune_r2 %>% filter(Powiat=="Warszawa")warsaw_combined <- data.frame( "TERYT"=146501, "Gmina"='Warszawa_ALL', "Powiat"='Warszawa', "Województwo"='mazowieckie', "Votes" = sum(warsaw$Votes), "NAWROCKI" = sum(warsaw$NAWROCKI), "TRZASKOWSKI" = sum(warsaw$TRZASKOWSKI))## remove the Warsaw districtscommune_r2 <- commune_r2 %>% dplyr::filter(Powiat !="Warszawa")commune_r2 <- rbind(commune_r2, warsaw_combined)## make precentages for each territorial unitcommune_r2$per_RT <- (commune_r2$TRZASKOWSKI/commune_r2$Votes) * 100commune_r2$per_KN <- (commune_r2$NAWROCKI/commune_r2$Votes) * 100## select just the relevant column(s)commune_r2_RT <- commune_r2 %>% dplyr::select(TERYT, Gmina, Powiat, Województwo, per_RT)commune_r2_KN <- commune_r2 %>% dplyr::select(TERYT, Gmina, Powiat, Województwo, per_KN)## merge data by ID columnPL25_RT <- PL25 %>% left_join(commune_r2_RT, by = c("CC_3" = "TERYT"))PL25_KN <- PL25 %>% left_join(commune_r2_KN, by = c("CC_3" = "TERYT"))## PARTY COLOURS:## https://en.wikipedia.org/wiki/Module:Political_party## Civic Platform: https://en.wikipedia.org/wiki/Module:Political_party/C## Law and Justice: https://en.wikipedia.org/wiki/Module:Political_party/Lmap_RT <- ggplot(PL25_RT)+ geom_sf(aes(fill = per_RT))+ scale_fill_gradient("RT %", low = "white", high = "#F68F2D")+ guides(fill = guide_colourbar(position = "bottom")) + theme_void()map_KN <- ggplot(PL25_KN)+ geom_sf(aes(fill = per_KN))+ scale_fill_gradient("KN %", low = "white", high = "#263778")+ guides(fill = guide_colourbar(position = "bottom")) + theme_void()```## Presidential Run-Off ResultsIt seems Poland's [Statistical Office](https://stat.gov.pl/en/regional-statistics/classification-of-territorial-units/administrative-division-of-poland/) does not offer an openly accessible shapefile for its subnational data, so we have to rely on the [GADM](https://gadm.org/about.html) geospatial files. We can merge that spatial data with the results at the commune (*gminy*) level provided by the National Electoral Commission: <https://wybory.gov.pl/prezydent2025/en/dane_w_arkuszach>. This allows us to visualise the geospatial divides in Polish politics at a highly granular level. @fig-map-percentage and @fig-maps-seperate show the stark east-west division. And similar to other countries, larger cities---here Warsaw, Poznań, Wrocław, Kraków, Gdańsk---are islands of more left-wing values and political support.<!-- Election results from National Electoral Commission: <https://wybory.gov.pl/prezydent2025/en/dane_w_arkuszach> --><!-- Gminy shapefile: <https://gis.openforestdata.pl/layers/geonode_data:geonode:Gminy_wgs84> --><!-- Eurostat NUTS data: <https://ec.europa.eu/eurostat/web/gisco/geodata/statistical-units/territorial-units-statistics> -->```{r map_per2, fig.cap="Map of presidential election results by commune. Darker blue communal areas voted more strongly for Karol Nawrocki. Darker orange communal areas voted more strongly for Rafał Trzaskowski."}#| label: fig-map-percentagecommune_r2$per_diff <- commune_r2$per_KN - commune_r2$per_RTmap_PL25 <- PL25 %>% left_join(commune_r2, by = c("CC_3" = "TERYT"))map_per <- ggplot(map_PL25)+ geom_sf(aes(fill = per_diff))+ scale_fill_gradient2( name = "RT %", low = "#F68F2D", mid = "white", high = "#263778", midpoint = 0 ) + guides(fill=guide_colourbar(position="bottom"))+ theme_void()commune_r2$tot_diff <- commune_r2$NAWROCKI - commune_r2$TRZASKOWSKI# commune_r2_noWarsaw <- commune_r2 %>% filter(Gmina !="Warszawa_ALL")map_PL25 <- PL25 %>% left_join(commune_r2, by = c("CC_3" = "TERYT"))# min_value <- -147063# max_value <- 11366library(ggnewscale)map_tot <- ggplot()+ geom_sf(data=map_PL25 %>% filter(tot_diff>0), aes(fill=tot_diff))+ scale_fill_gradient(name="Pos diff", low="white", high="#263778")+ new_scale_fill()+ geom_sf(data=map_PL25 %>% filter(tot_diff<0), aes(fill=tot_diff))+ scale_fill_gradient(name="Neg diff", low="#F68F2D", high="white")+ theme_void()# library(scales)# # ggplot()+# geom_sf(data=map_PL25 %>% filter(tot_diff>0),# aes(fill=rescale((per_diff * Votes), to=c(0,100))))+# scale_fill_gradient(name="Pos diff", low="white", high="navy")+# new_scale_fill()+# geom_sf(data=map_PL25 %>% filter(tot_diff<0),# aes(fill=rescale((per_diff * Votes), to=c(0,100))))+# scale_fill_gradient(name="Neg diff", low="orange", high="white")+# theme_void()# ggplot()+# geom_sf(data=map_PL25 %>% filter(tot_diff>0),# aes(fill=per_diff*Votes))+# scale_fill_gradient2(name="Pos diff", # low="white", mid="dodgerblue", # high="dodgerblue4", midpoint = 10000)+# new_scale_fill()+# geom_sf(data=map_PL25 %>% filter(tot_diff<0),# aes(fill=per_diff))+# scale_fill_gradient2(name="Neg diff", # low="orange3", mid="orange", # high="white", midpoint = 100000)+# theme_void()library(RColorBrewer)map_per2 <- ggplot()+ geom_sf(data=map_PL25 %>% filter(tot_diff>0), aes(fill=per_diff))+ scale_fill_distiller(palette = "PuBu", direction = 1, guide="none")+ new_scale_fill()+ geom_sf(data=map_PL25 %>% filter(tot_diff<0), aes(fill=per_diff))+ scale_fill_distiller(palette = "Oranges", guide="none")+ theme_void()map_per2``````{r maps, fig.cap="Maps of communes coloured by strength of electoral performance. The left map shows Trzaskowski's performance in the run-off presidential election; the right map shows Nawrocki's."}#| label: fig-maps-seperate##, fig.width=6library(cowplot)maps_PL25 <- plot_grid(map_RT, map_KN, nrow = 1, align = "h") # theme(plot.background=element_rect(color = "black"))maps_PL25``````{r}tab_elec <- commune_r2 %>% dplyr::rename(Trzaskowski = TRZASKOWSKI,Nawrocki = NAWROCKI,perc_TRZ = per_RT,perc_NAW = per_KN,# percent_difference = per_diff,# total_vote_difference = tot_diff ) %>% dplyr::select(Gmina, Votes, Nawrocki, perc_NAW, Trzaskowski, perc_TRZ)tab_elec <- tab_elec %>%mutate_at(vars(perc_TRZ, perc_NAW), funs(round(., 1)))## FOR HTMLlibrary(DT)datatable(tab_elec, rownames =FALSE,colnames =c('Gmina', 'Votes', 'Nawrocki', '% Naw.', 'Trzaskowski', '% Trz.'),caption ='Presidential Run-Off results by commune (gminy).',filter ='top', options =list(pageLength =10, autoWidth =FALSE))```## 2023 Sejm Election ResultsGeospatial patterns in the 2025 Presidential Run-Off were also present in the parliamentary elections of late 2023 (<https://sejmsenat2023.pkw.gov.pl/sejmsenat2023/en/dane_w_arkuszach>). @fig-map-sejm show the electoral map of communes for the Sejm by grouping (in orange) the parties that eventually joined Donald Tusk's coalition government---KO, *Polska 2050*, *Polskie Stronnictwo Ludowe*, and *Nowa Lewica*---and grouping (in blue) the PiS-led United Right alliance and the far-right *Konfederacja* party. The same patterns of east-west and rural-urban are readily apparent, though the overall electoral performance by the then-opposition parties was stronger than Trzaskowski in the run-off.<!-- - predict presidential vote totals in communes based on percentages in communes for parliamentary elections -->```{r map_parl, fig.cap="Map of parliamentary election results", fig.width=6}#| label: fig-map-sejm# commune_parl <- read_delim("pl_parl2023/wyniki_gl_na_listy_po_gminach_proc_sejm_utf8.csv",# delim = ";", escape_double = FALSE, trim_ws = TRUE)commune_parl <- read.csv2("pl_parl2023/wyniki_gl_na_listy_po_gminach_proc_sejm_utf8.csv", header=TRUE)# View(commune_parl)commune_parl <- commune_parl %>% dplyr::select(`TERYT.Gminy`, Gmina, Powiat, Województwo, `KOALICYJNY.KOMITET.WYBORCZY.TRZECIA.DROGA.POLSKA.2050.SZYMONA.HOŁOWNI...POLSKIE.STRONNICTWO.LUDOWE`, `KOMITET.WYBORCZY.NOWA.LEWICA`, `KOMITET.WYBORCZY.PRAWO.I.SPRAWIEDLIWOŚĆ`, `KOMITET.WYBORCZY.KONFEDERACJA.WOLNOŚĆ.I.NIEPODLEGŁOŚĆ`, `KOALICYJNY.KOMITET.WYBORCZY.KOALICJA.OBYWATELSKA.PO..N.IPL.ZIELONI`) %>% dplyr::rename(TERYT = `TERYT.Gminy`, ThirdWay = `KOALICYJNY.KOMITET.WYBORCZY.TRZECIA.DROGA.POLSKA.2050.SZYMONA.HOŁOWNI...POLSKIE.STRONNICTWO.LUDOWE`, NewLeft = `KOMITET.WYBORCZY.NOWA.LEWICA`, PiS = `KOMITET.WYBORCZY.PRAWO.I.SPRAWIEDLIWOŚĆ`, Konfed = `KOMITET.WYBORCZY.KONFEDERACJA.WOLNOŚĆ.I.NIEPODLEGŁOŚĆ`, PO = `KOALICYJNY.KOMITET.WYBORCZY.KOALICJA.OBYWATELSKA.PO..N.IPL.ZIELONI`)## remove rows with NA for TERYTcommune_parl <- commune_parl[!is.na(commune_parl$TERYT),]## take out Warsaw districts and combine themwarsaw <- commune_parl %>% filter(Powiat=="Warszawa")warsaw_combined <- data.frame( "TERYT"=146501, "Gmina"='Warszawa_ALL', "Powiat"='Warszawa', "Województwo"='mazowieckie', "ThirdWay" = mean(warsaw$ThirdWay), "NewLeft" = mean(warsaw$NewLeft), "PiS" = mean(warsaw$PiS), "Konfed" = mean(warsaw$Konfed), "PO" = mean(warsaw$PO))## remove the Warsaw districtscommune_parl <- commune_parl %>% dplyr::filter(Powiat !="Warszawa")commune_parl <- rbind(commune_parl, warsaw_combined)## make gov and opposition groupingscommune_parl$new_coalition = (commune_parl$ThirdWay + commune_parl$NewLeft + commune_parl$PO)commune_parl$new_opposition = (commune_parl$PiS + commune_parl$Konfed)## merge data by ID columnPL23 <- PL25 %>% left_join(commune_parl, by = c("CC_3" = "TERYT"))map_per_parl <- ggplot()+ geom_sf(data=PL23 %>% filter(new_opposition>new_coalition), aes(fill=new_opposition))+ scale_fill_distiller(palette = "PuBu", direction = 1, guide="none")+ new_scale_fill()+ geom_sf(data=PL23 %>% filter(new_coalition>new_opposition), aes(fill=new_coalition))+ scale_fill_distiller(palette = "Oranges", guide="none")+ theme_void()map_per_parl```<!-- PL 2023 parl election: <https://sejmsenat2023.pkw.gov.pl/sejmsenat2023/en/dane_w_arkuszach> -->## Change from 2023 to 2025 @fig-prediction shows that, whereas Trzaskowski underperformed from the 2023 cumulative election performance of the parties that eventually formed current government coalition, Nawrocki generally overperformed. ```{r predict, message=FALSE, warning=FALSE, fig.cap="Correlation of 2023 Sejm results and 2025 Presidential Run-Off results."}#| label: fig-predictioncommune_compare <- commune_r2 %>% left_join(commune_parl, by = c("TERYT" = "TERYT"))# plot(x=commune_compare$new_coalition, y=commune_compare$per_RT)# plot(x=commune_compare$new_opposition, y=commune_compare$per_KN)commune_compare$new_diff = commune_compare$new_opposition - commune_compare$new_coalition# plot(x=commune_compare$new_diff, y=commune_compare$per_diff)scat_RT <- ggplot(commune_compare, aes(x=new_coalition, y=per_RT))+ geom_point(shape=18, color="#F68F2D")scat_KN <- ggplot(commune_compare, aes(x=new_opposition, y=per_KN))+ geom_point(shape=18, color="#263778")scats <- plot_grid(scat_RT, scat_KN, nrow = 2, align = "h") # theme(plot.background=element_rect(color = "black"))# scatsggplot(commune_compare)+ geom_point(aes(x=new_opposition, y=per_KN), shape=0, color="#263778")+ geom_smooth(aes(x=new_opposition, y=per_KN), method="lm", color="#263778", se=FALSE)+ geom_point(aes(x=new_coalition, y=per_RT), shape=1, color="#F68F2D")+ geom_smooth(aes(x=new_coalition, y=per_RT), method="lm", color="#F68F2D", se=FALSE)+ scale_x_continuous("2023 Parliamentary election commune vote %", breaks=seq(0,100,25), limits=c(0,100))+ scale_y_continuous("2025 Presidential Run-Off election commune vote %", breaks=seq(0,100,25), limits=c(0,100))+ theme_bw()+ theme(axis.text.x=element_text(size=14), axis.text.y=element_text(size=14), axis.title.x=element_text(size=14), axis.title.y=element_text(size=14))```This differential is even clearer in @fig-comparison where most communes shifted their vote to Nawrocki.```{r compare, message=FALSE, warning=FALSE, fig.cap="Map of shifts in election percentage. The sea of blue shades show that voting in most communes (whether due to changes in turnout or changes in voter preference) shifted from 2023 to 2025.", fig.width=6}#| label: fig-comparisoncommune_compare$net = commune_compare$per_diff - commune_compare$new_diffPLcompare <- PL25 %>% left_join(commune_compare, by = c("CC_3" = "TERYT"))commune_compare_per <- ggplot(PLcompare)+ geom_sf(aes(fill = net))+ scale_fill_gradient2( name = "change in percentage", low = "#F68F2D", mid = "white", high = "#263778", midpoint = 0 ) + guides(fill=guide_colourbar(position="bottom"))+ theme_void()commune_compare_per```These geospatial patterns overall represent continuity in Polish political divisions, perhaps combined with two elections of high oppositional turnout. But continued divided government, with parliament controlled by Tusk's centrist coalition and the presidency occupied by the PiS-aligned Nawrocki, will likely constrain or stymie Tusk's legislative agenda. Among other repercussions, this means that it will be harder to unwind some of the illiberalising changes imposed by the previous PiS-led governments.<!-- You can download the data by clicking the button below. --><!-- ```{r echo = F, collapse = TRUE, comment = "#>", message = FALSE, warning=FALSE} --><!-- library(downloadthis) --><!-- antiAfD_geo_sf %>% download_this( --><!-- output_name = "compact_bwr", --><!-- output_extension = ".xlsx", --><!-- button_label = "Download dataset as xlsx", --><!-- button_type = "warning", --><!-- has_icon = TRUE, --><!-- icon = "fa fa-save" --><!-- ) --><!-- ``` --><!-- ****** --><!-- <span style="font-family:Garamond; font-size:0.8em;">The basic data is taken from the monitoring by the <a href="https://taz.de/">TAZ newspaper</a>, which has kept a monitor of the recent demonstrations against the AfD, available at <a href="https://taz.de/demo">https://taz.de/demo</a>.</a></span> -->